


Measuring WordPress Server Speed and Performance
How we measure WordPress backend speed on heavy membership and LMS sites: the tests, tools and numbers that matter more than a PageSpeed score.
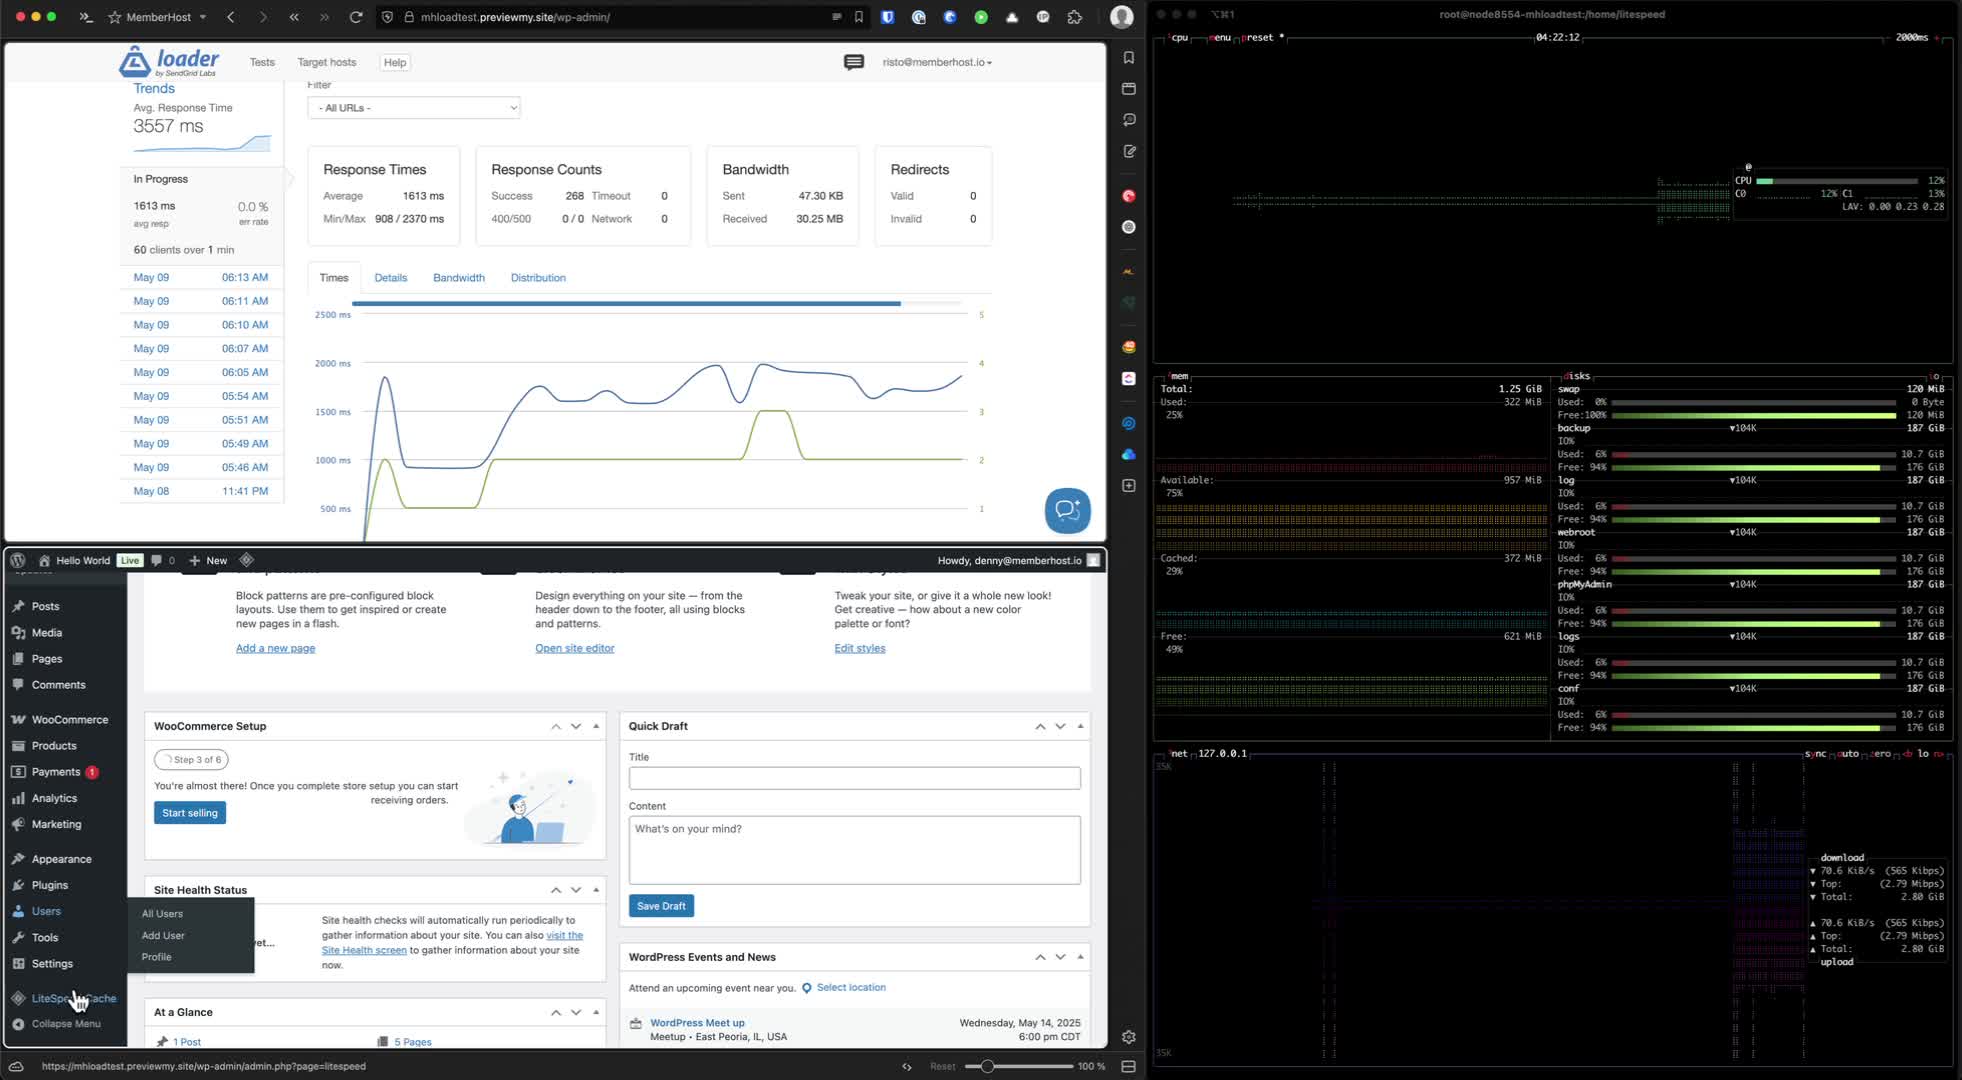
It’s important to understand that the way we look at performance and “speed” for membership sites, eLearning sites, community sites, WooCommerce sites, and other “heavy” (and often paywalled) WordPress sites is fundamentally different from the popular understanding.
Factors such as a heavy tech stack, large numbers of concurrent users, lots of dynamic content (meaning we can’t just go nuclear on caching), and high traffic, all inform a different approach than a static marketing site.
In fact, what the industry won’t tell you is that if you have a static site of any kind, you can run it on a $10 server and cache the bejesus out of it and it will work perfectly well.
Not so with memberships and other types of large, dynamic WordPress sites.
In this article we discuss some of the ways we approach quantifying performance of the WordPress backend to help us understand what practical performance for these types of sites really looks like.
Objective
Here we’ll outline the steps to measure backend server speed and performance effectively using tools and techniques discussed in the accompanying video below.
Key Steps
1. Introduction to Backend Performance Measurement
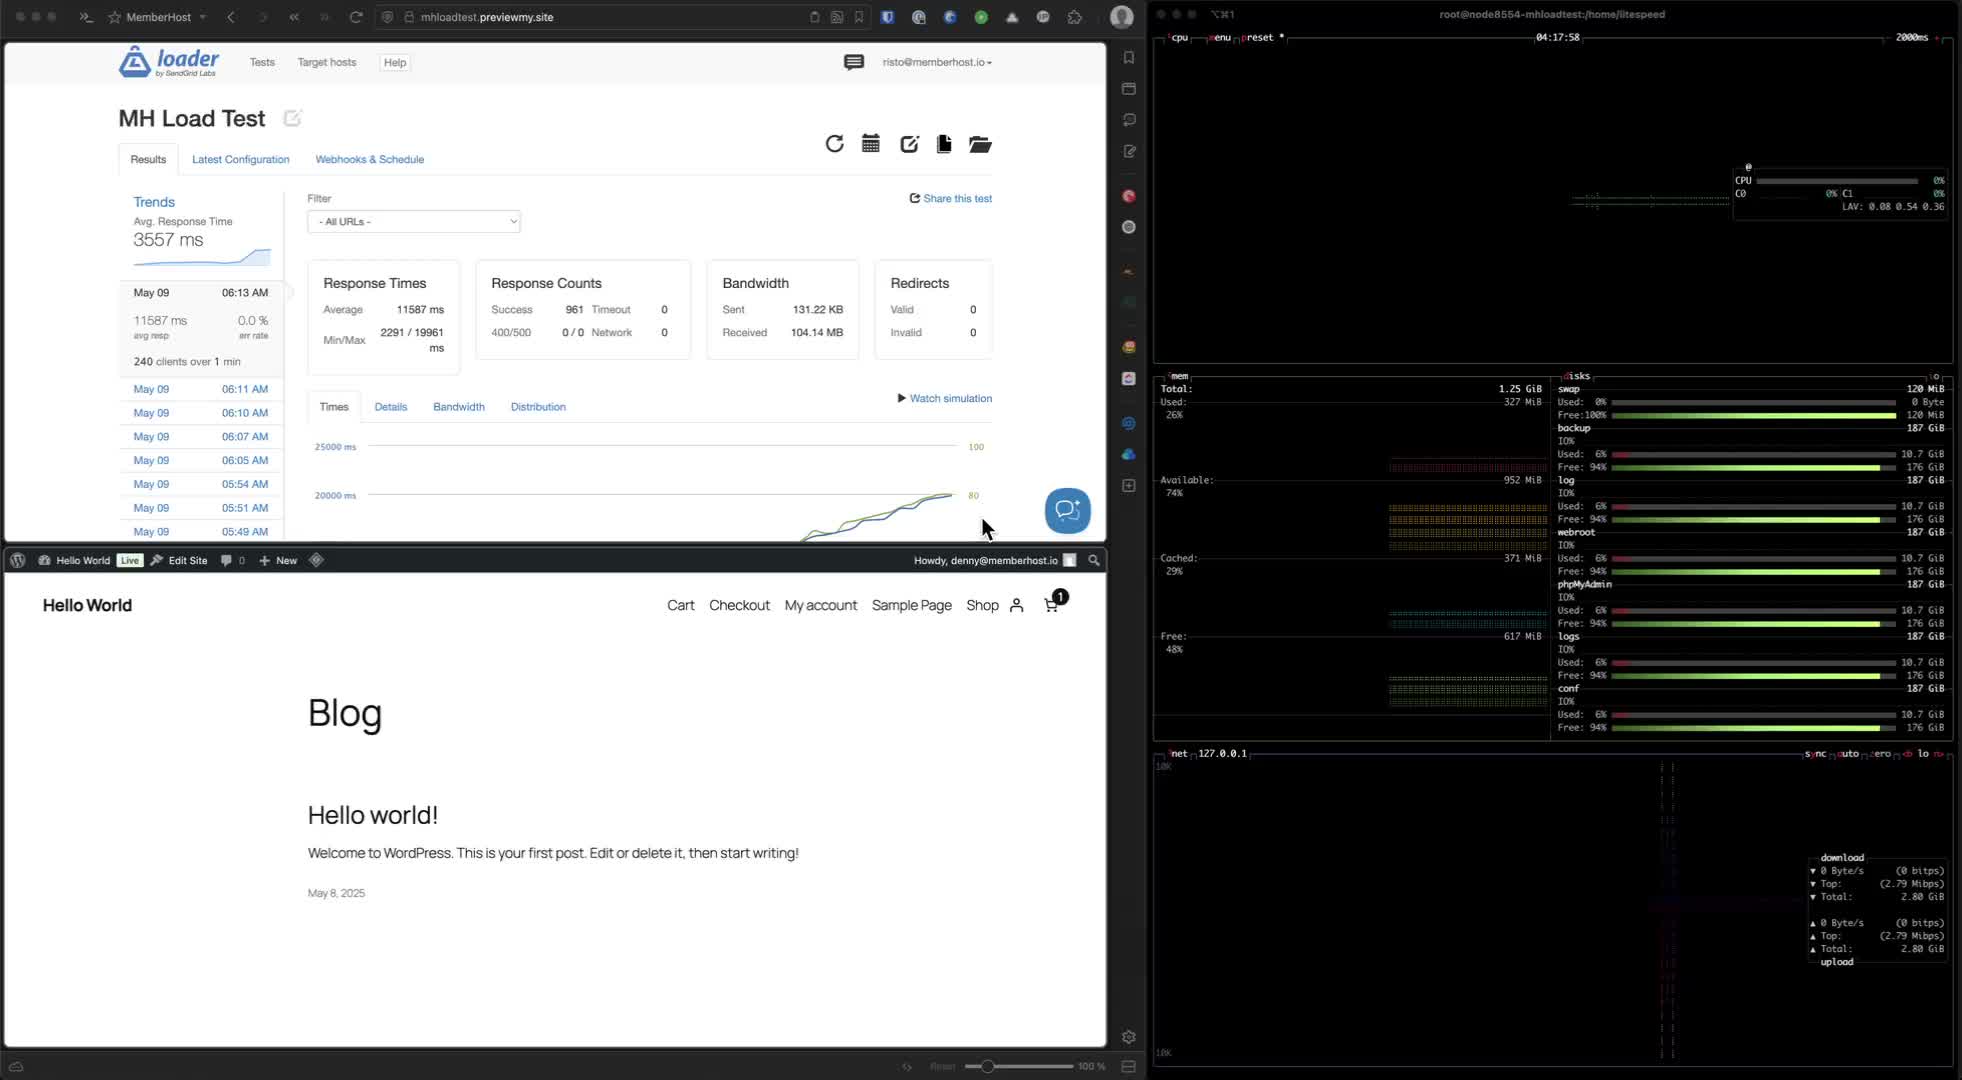
- Understand the importance of backend server speed and performance.
- Recognize that subjective testing (clicking around) is not sufficient for objective measurement.
- Load testing is important. We use loader.io and k6.
2. Avoid Common Misconceptions
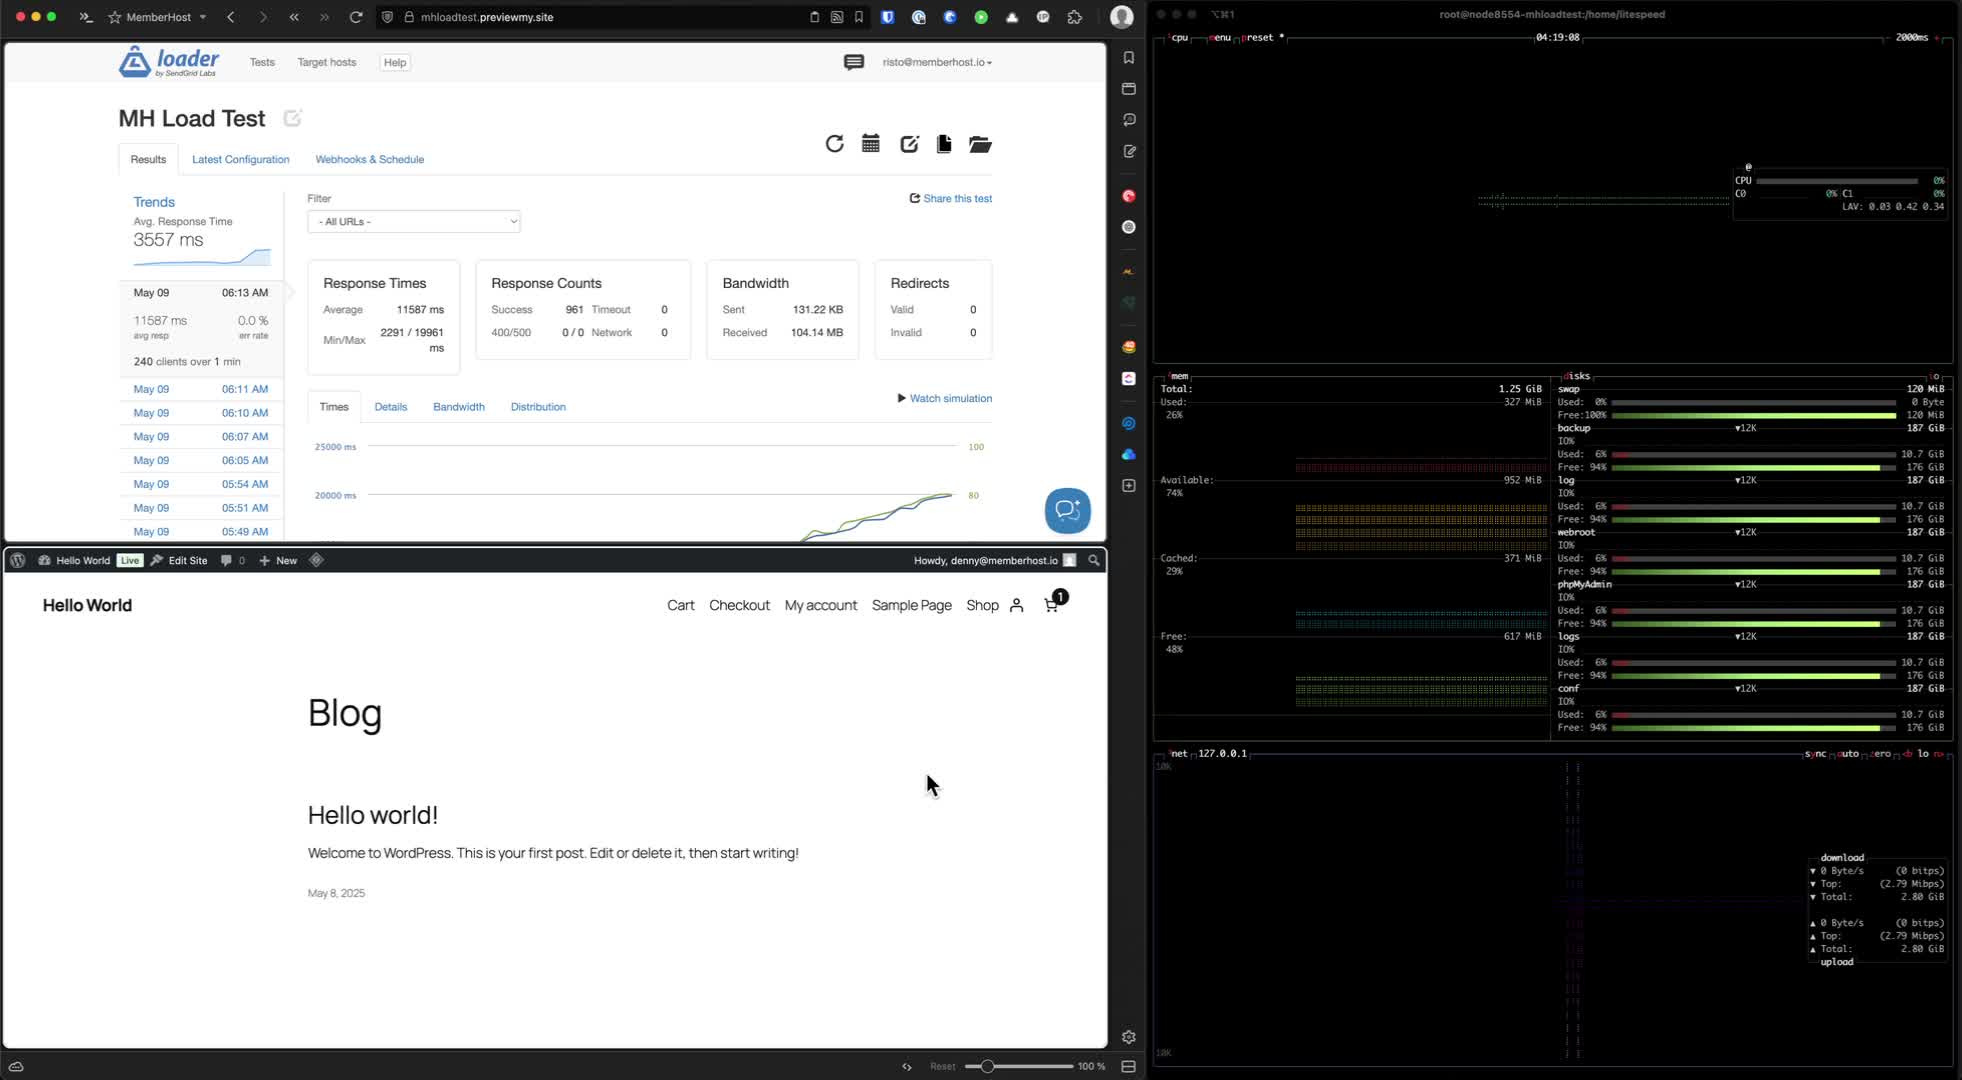
- Do not rely solely on tools like GTmetrix or PageSpeedTools for comparisons.
- Understand that production sites often have optimizations that staging sites may lack.
3. Identify Key Performance Metrics
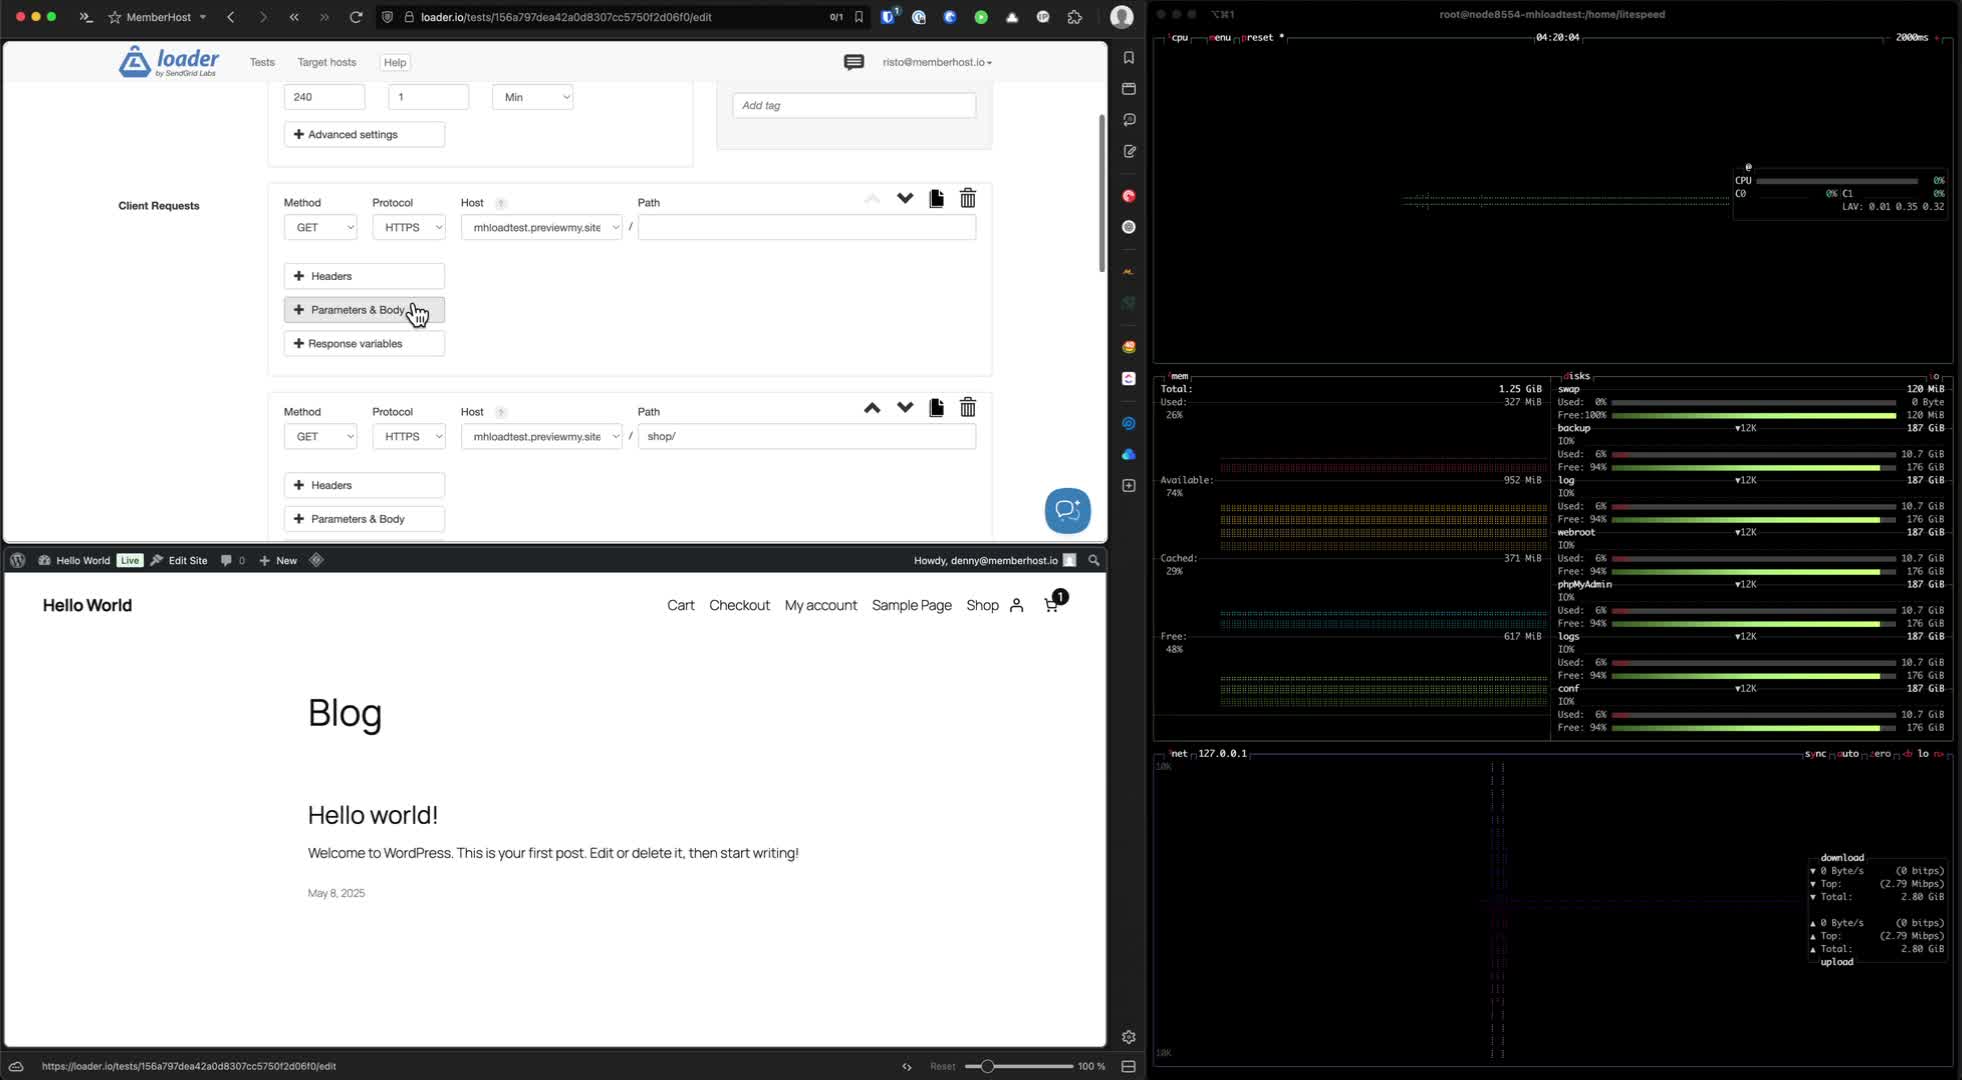
- Focus on dynamic actions like adding items to cart and visiting membership pages.
- Recognize that these actions incur backend costs related to CPU performance.
4. Set Up Comparison Sites
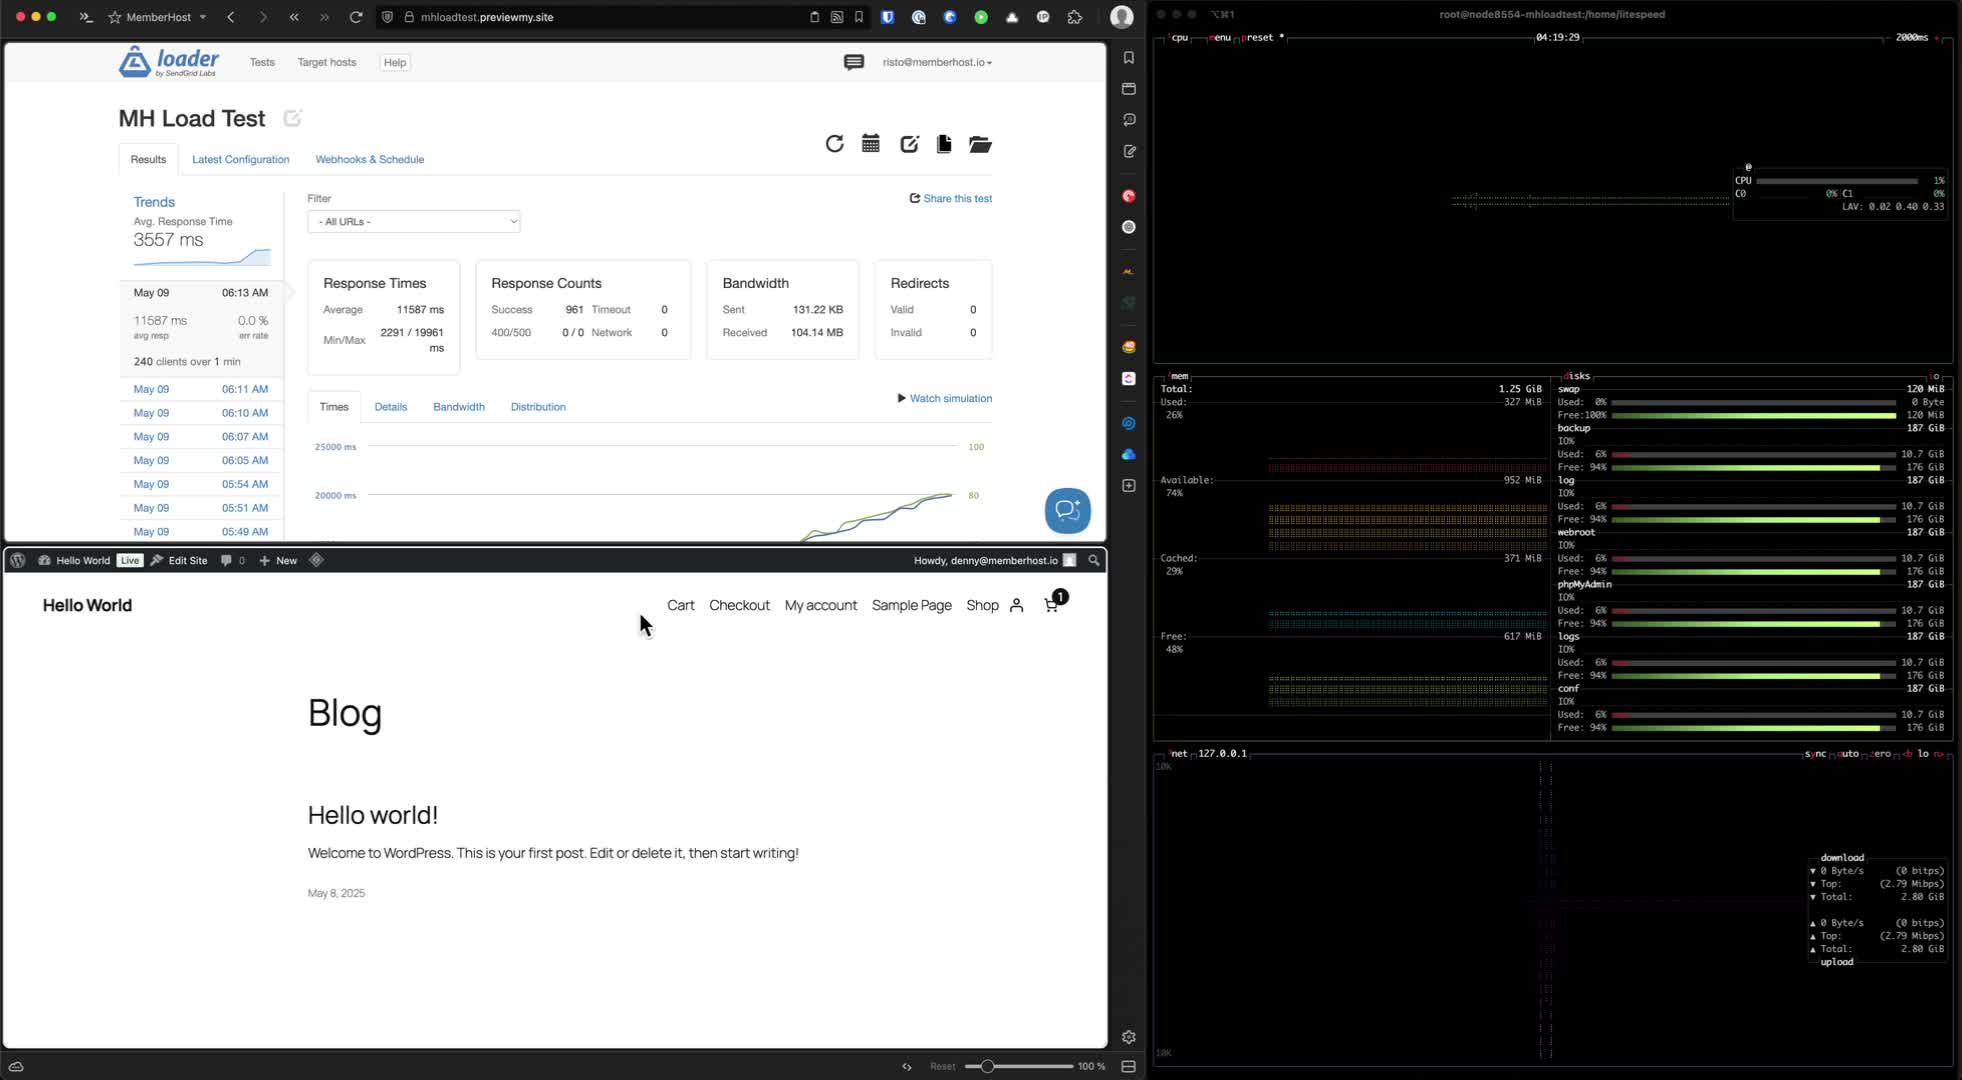
- Use two sites for comparison: one on Digital Ocean and one on MemberHost.
- Ensure both sites are running similar configurations (e.g., Redis object caching).
5. Install Activity Simulator Plugin
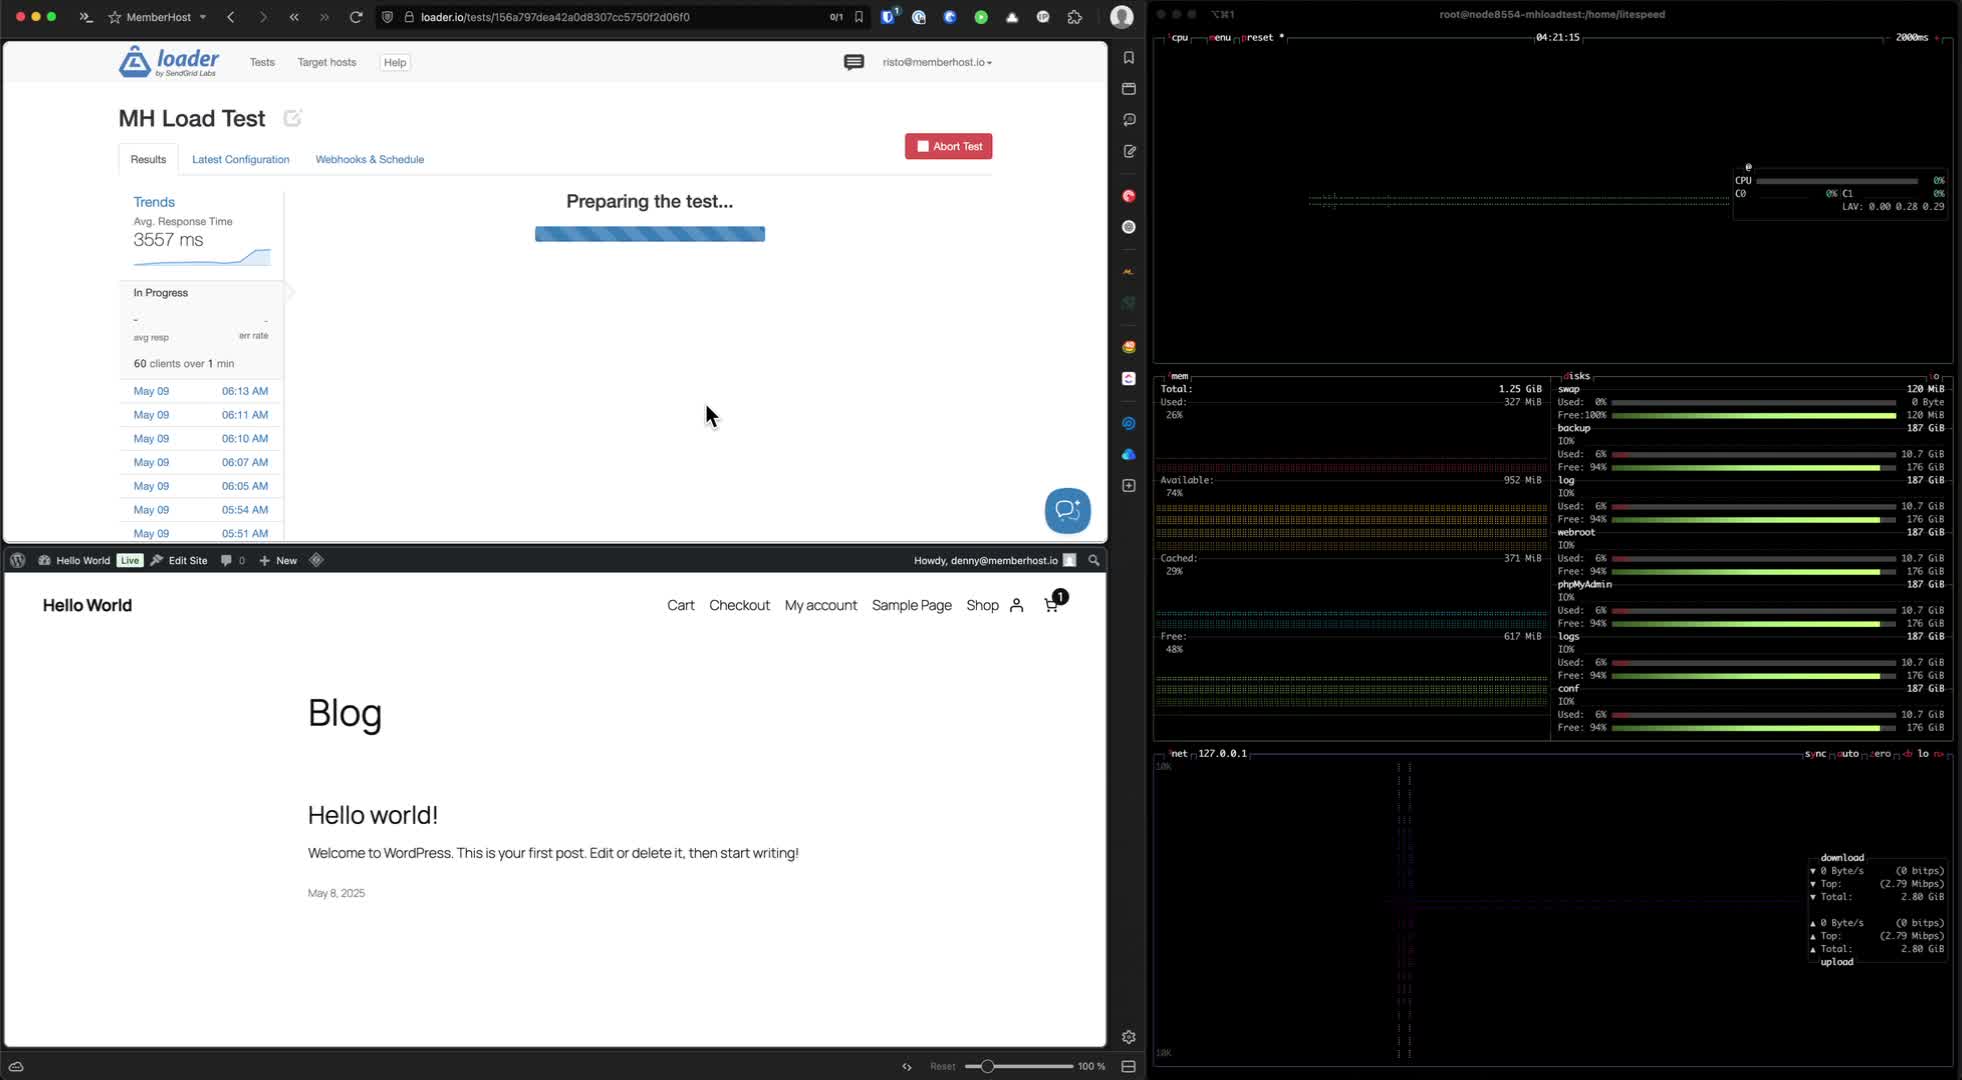
- Install a plugin that allows for synthetic performance testing.
- Use this tool to generate results for comparison.
6. Install Query Monitor
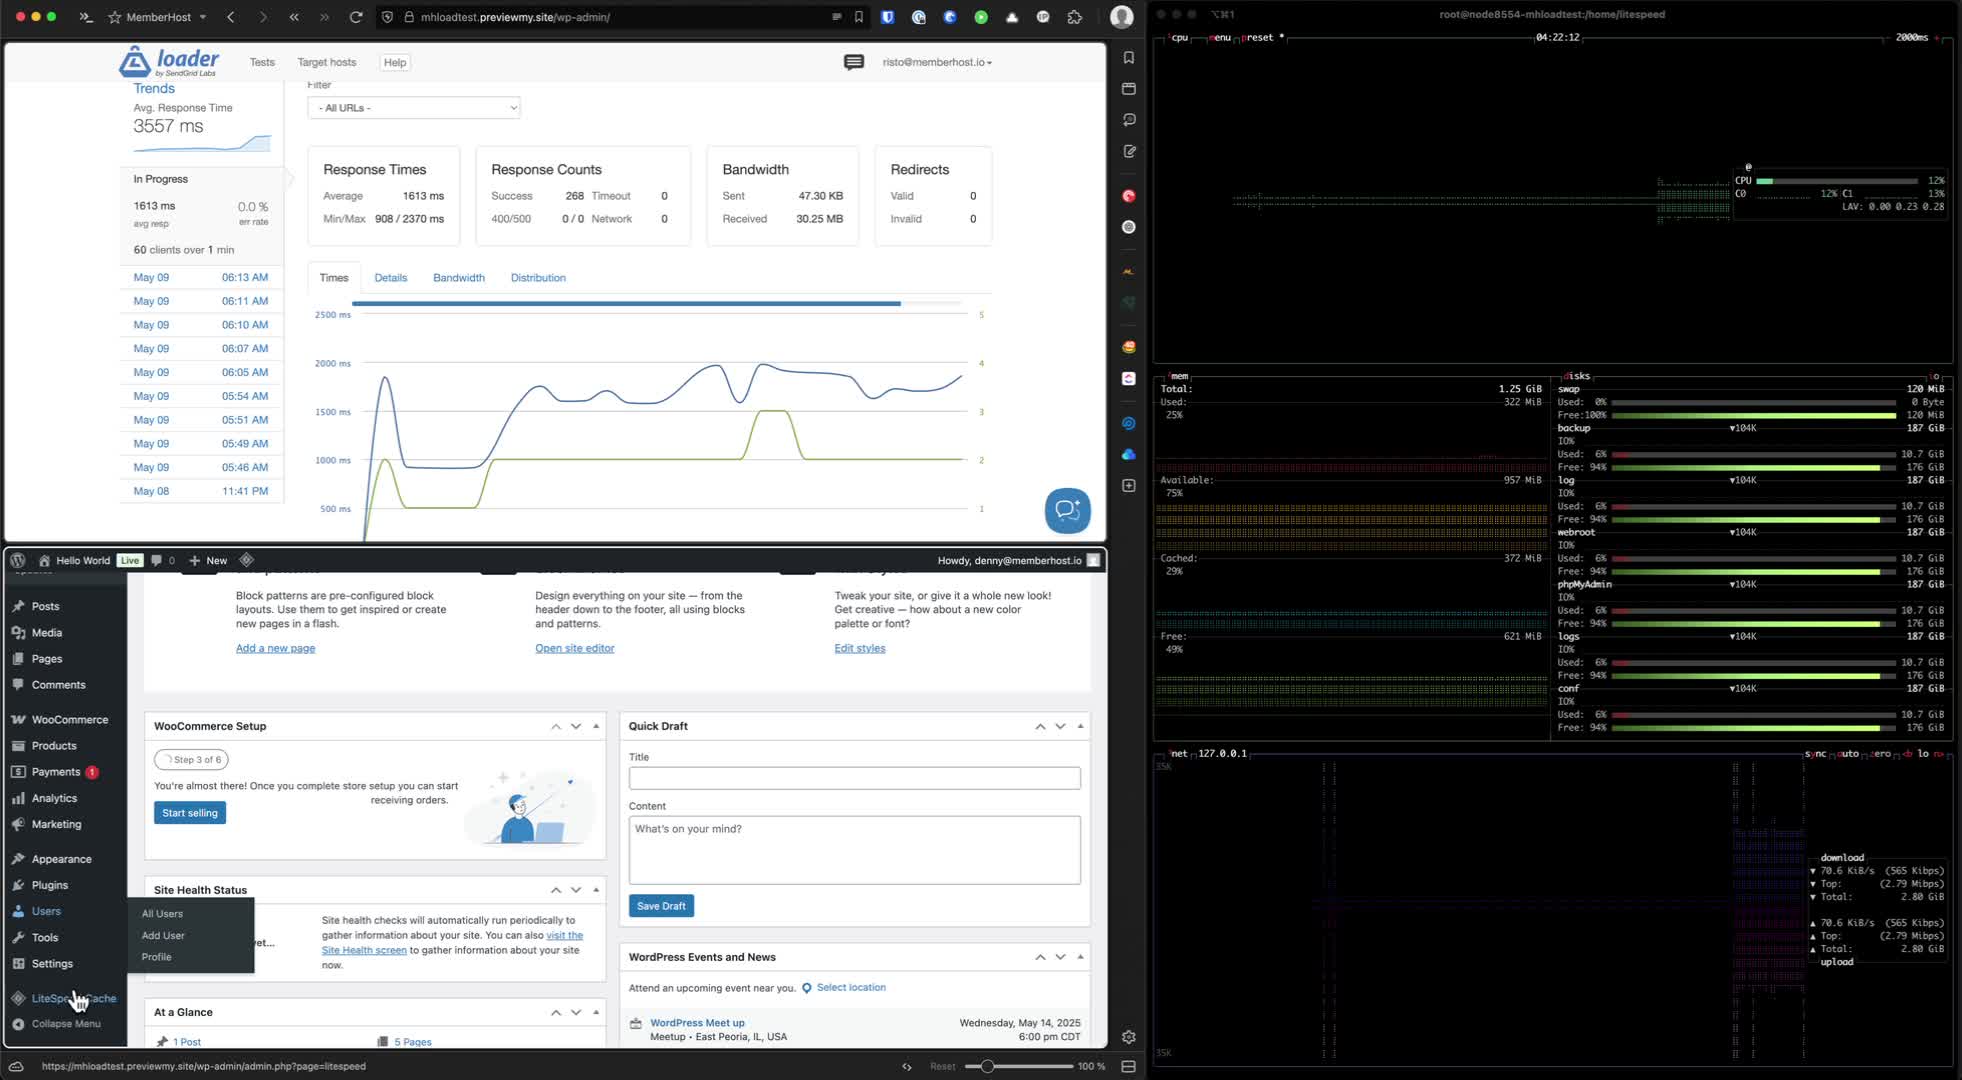
- Install Query Monitor on both sites to analyze page generation time and database queries.
- Use it to break down performance metrics: overall page generation time, memory usage, database queries, and their execution time.
7. Analyze Performance Data
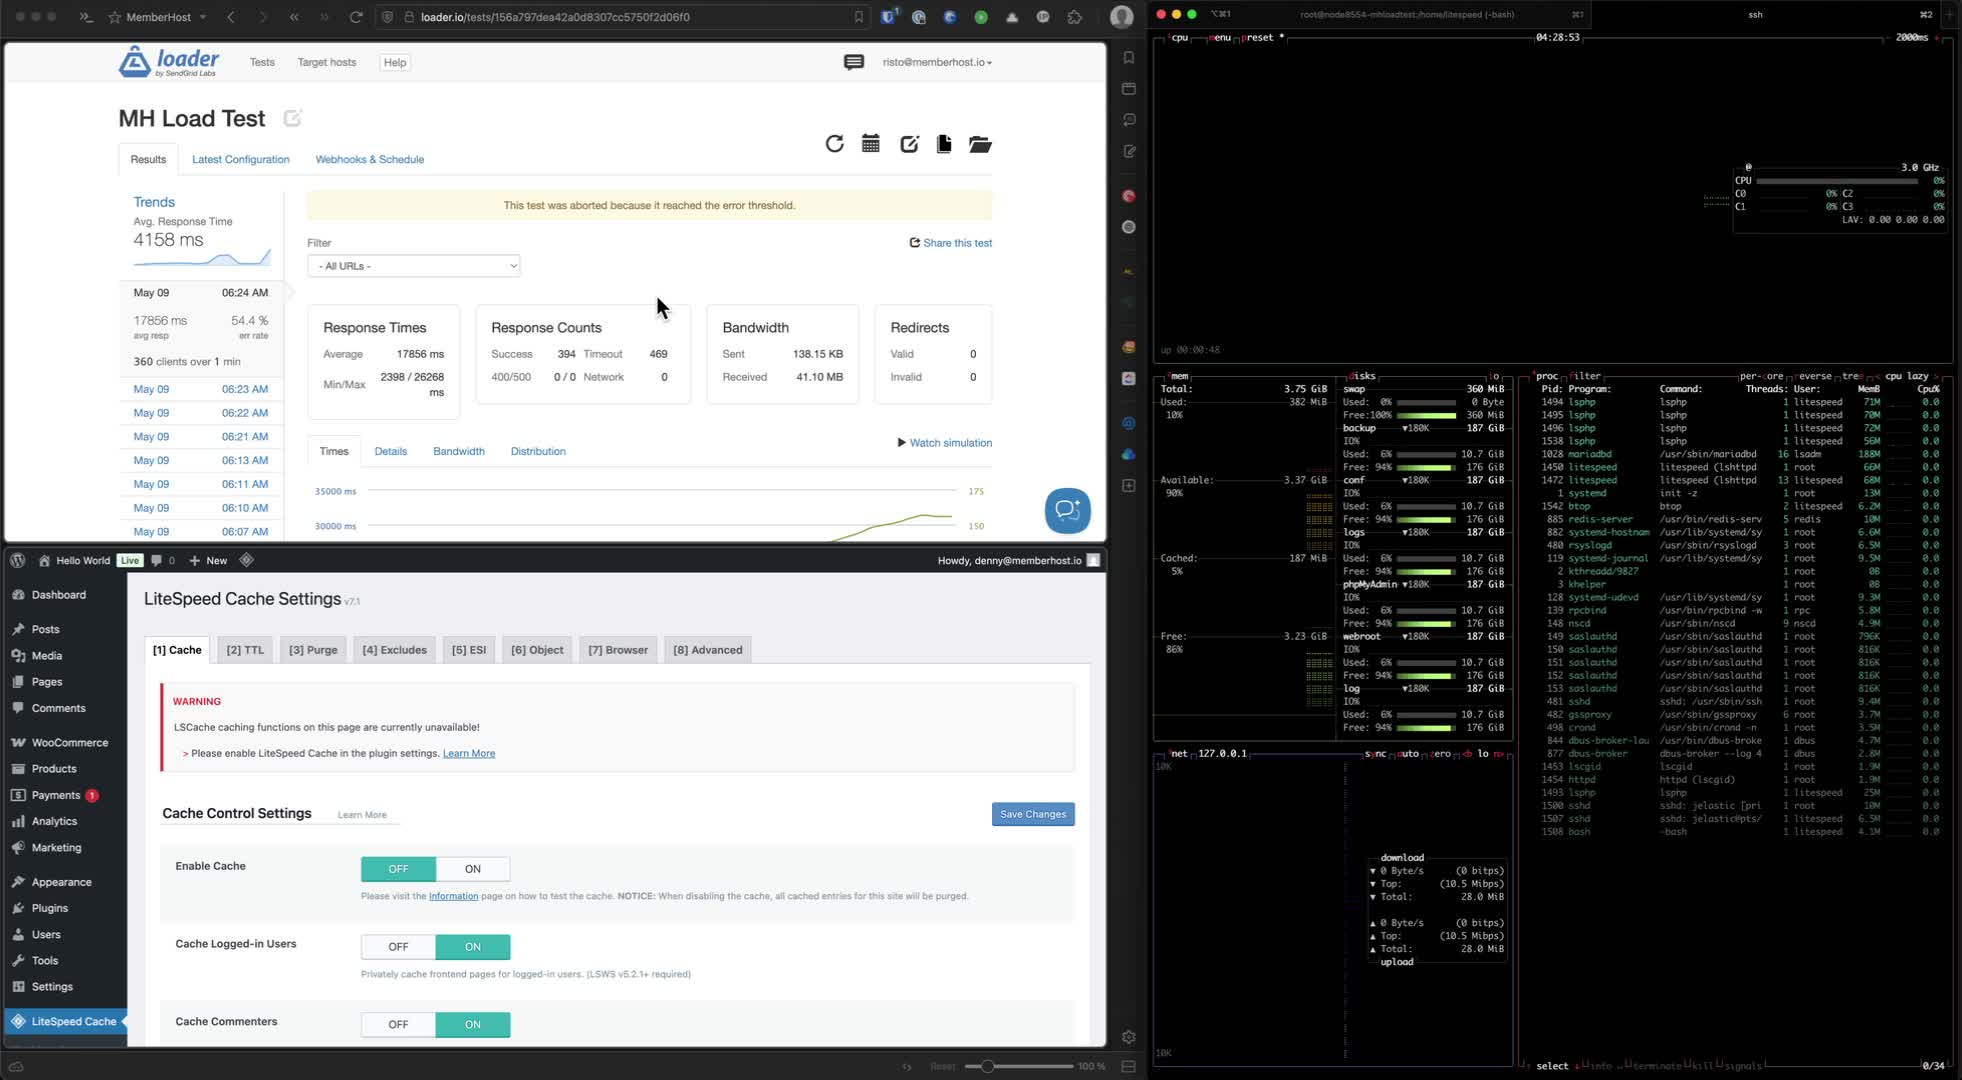
- Compare the number of database queries and their execution times between the two sites.
- Ensure that both sites are tested under similar conditions for valid comparisons.
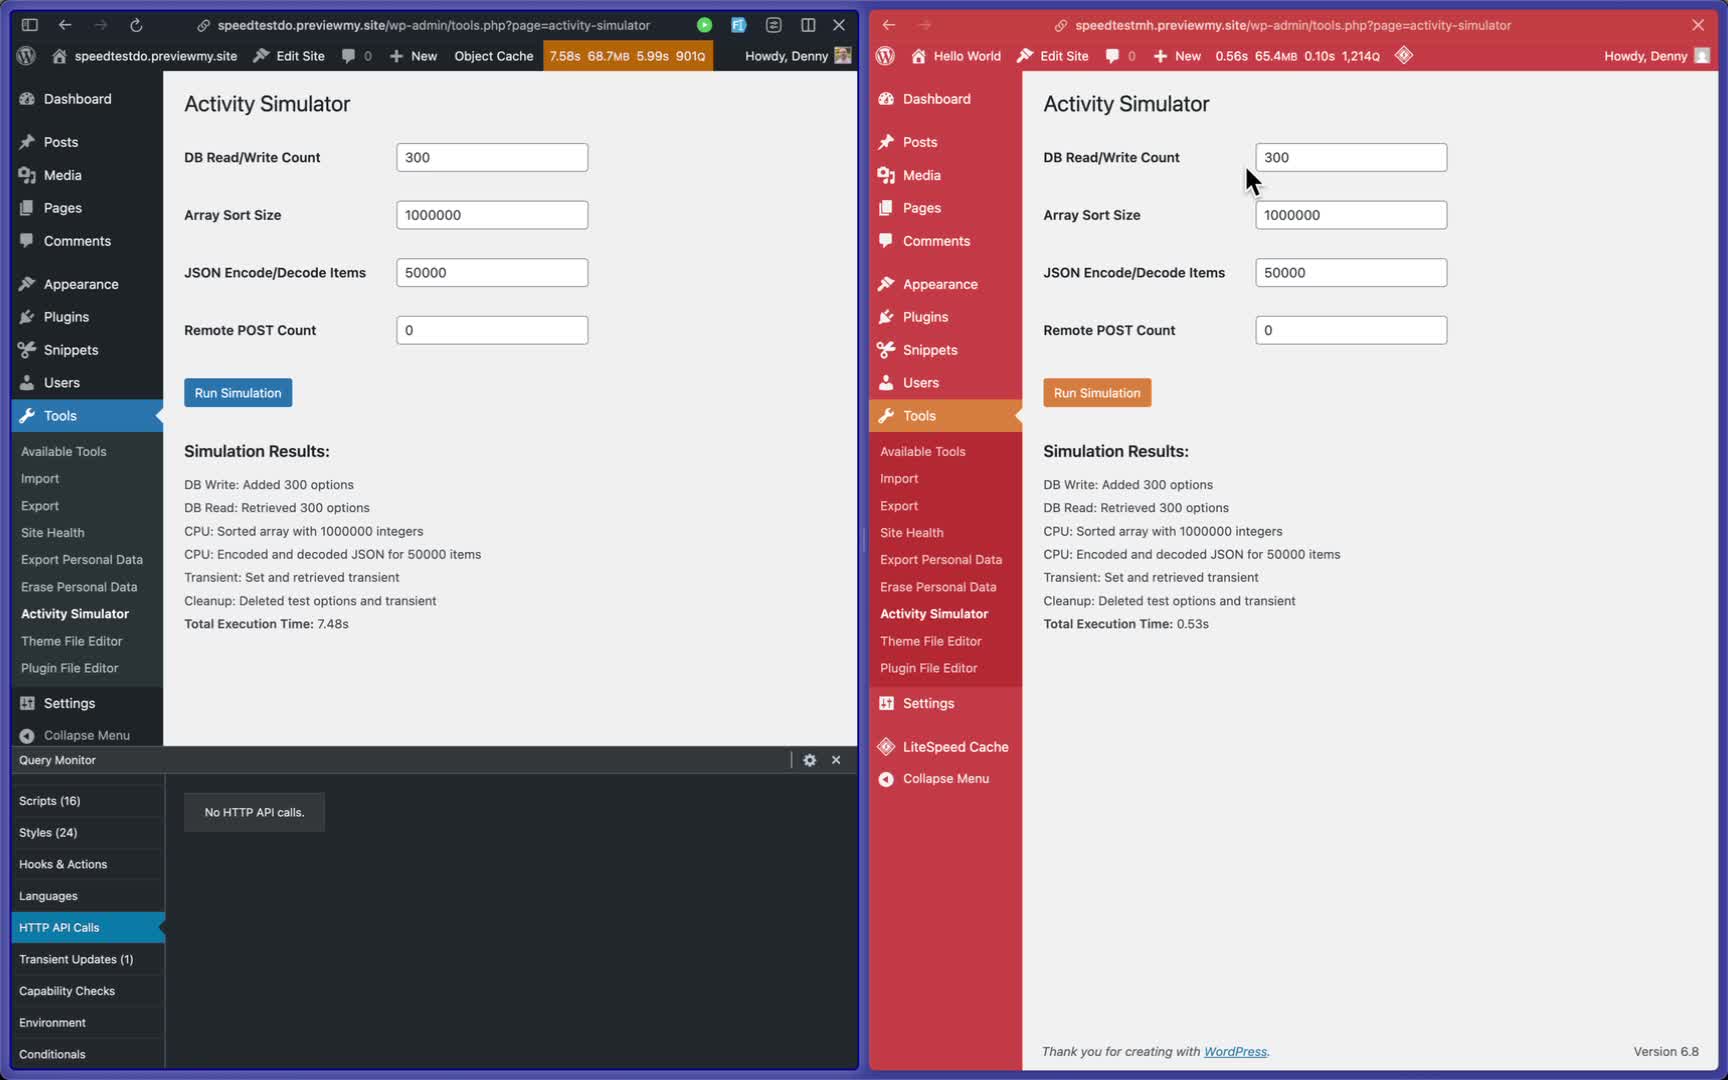
8. Conduct Activity Simulations
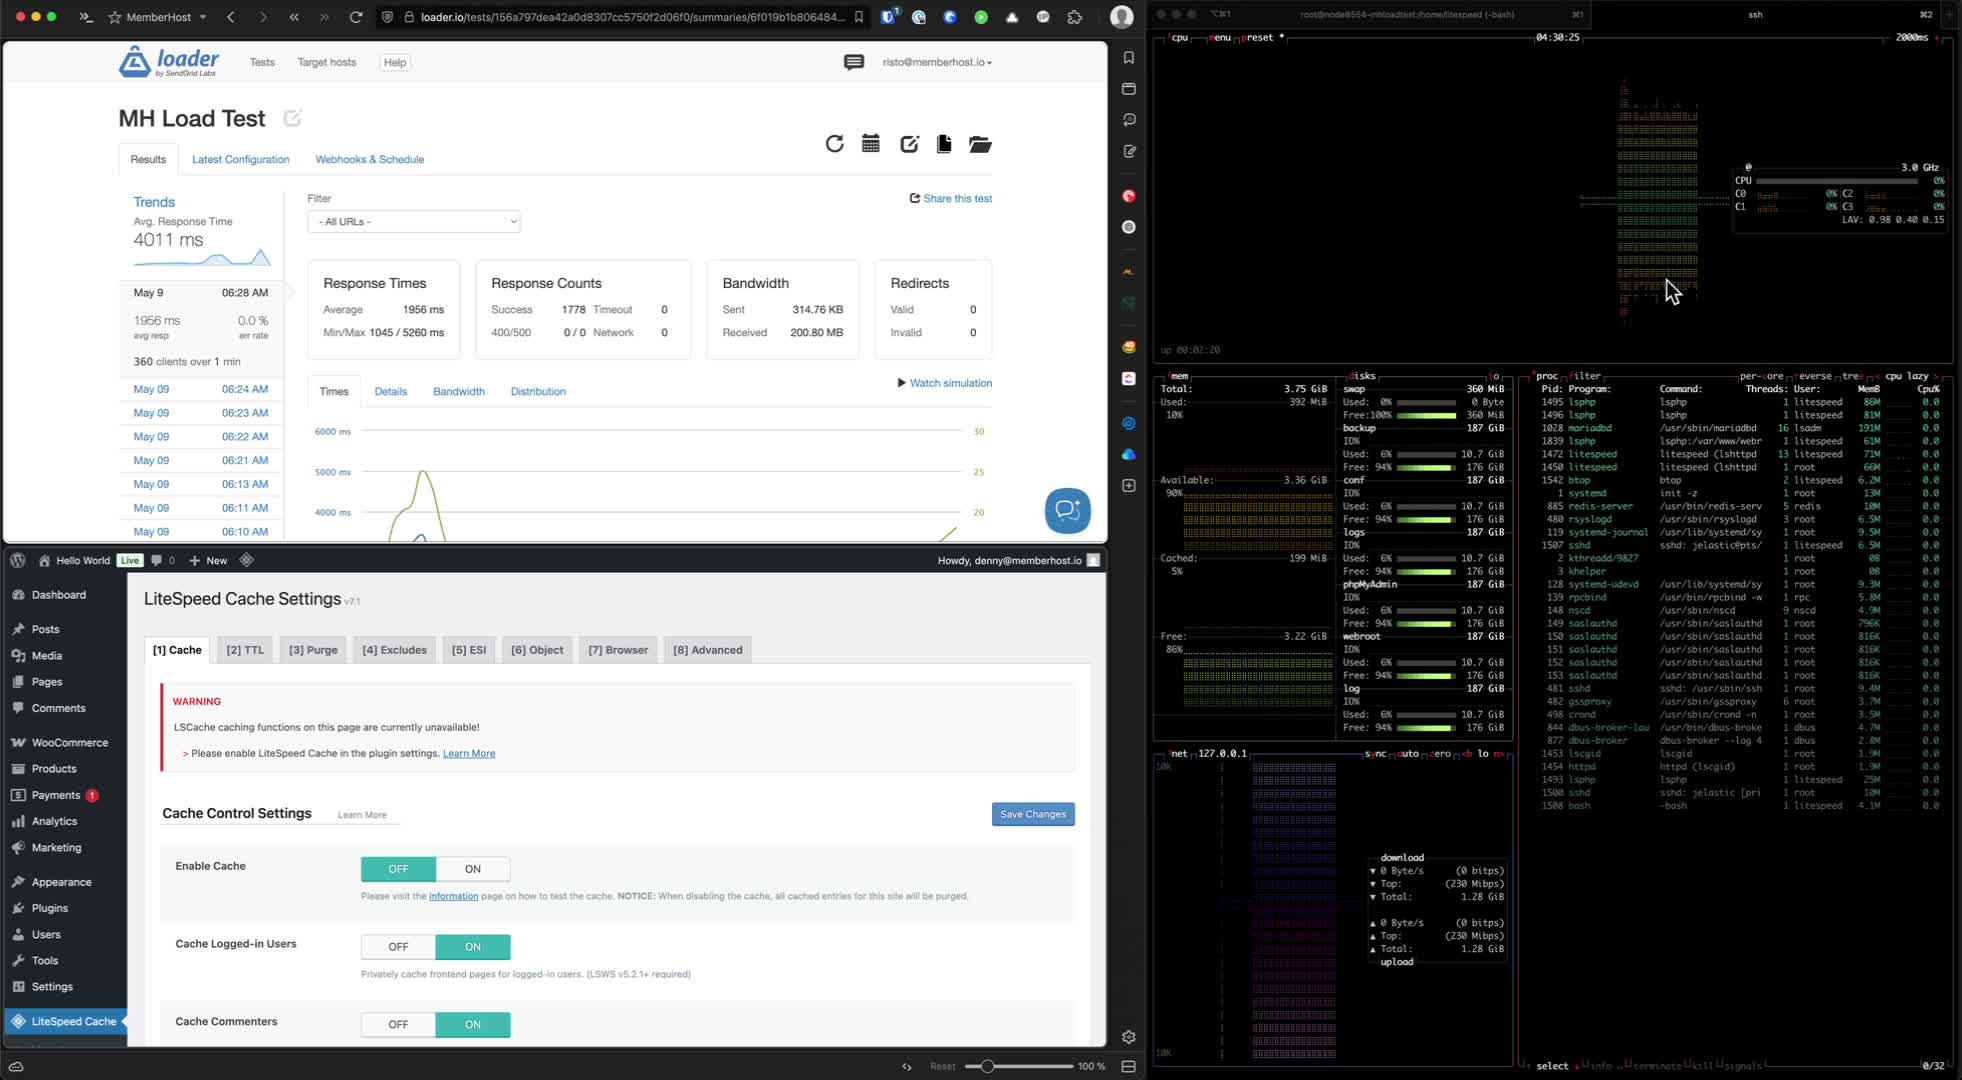
- Run the activity simulator on both sites to observe performance differences.
- Record the time taken for each simulation and the number of queries executed.
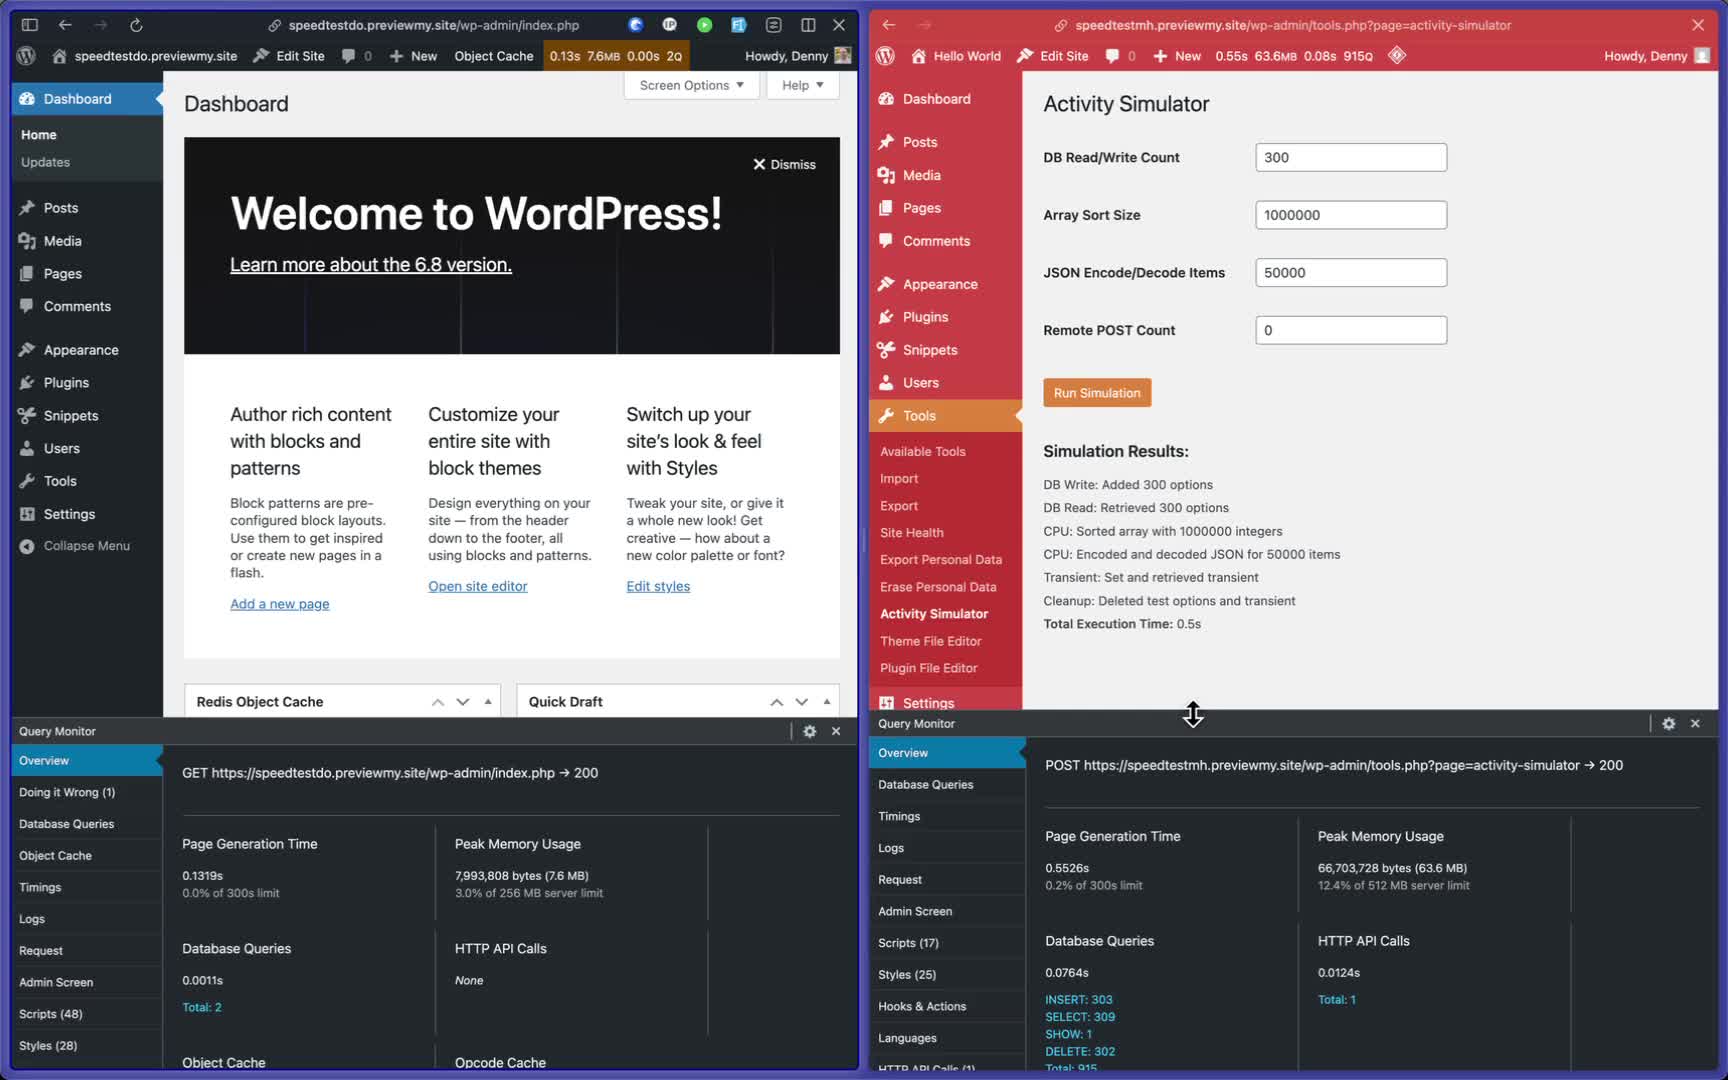
9. Identify Bottlenecks
- Look for any HTTP calls that may slow down performance.
- Check for remote server response times that could affect the test.
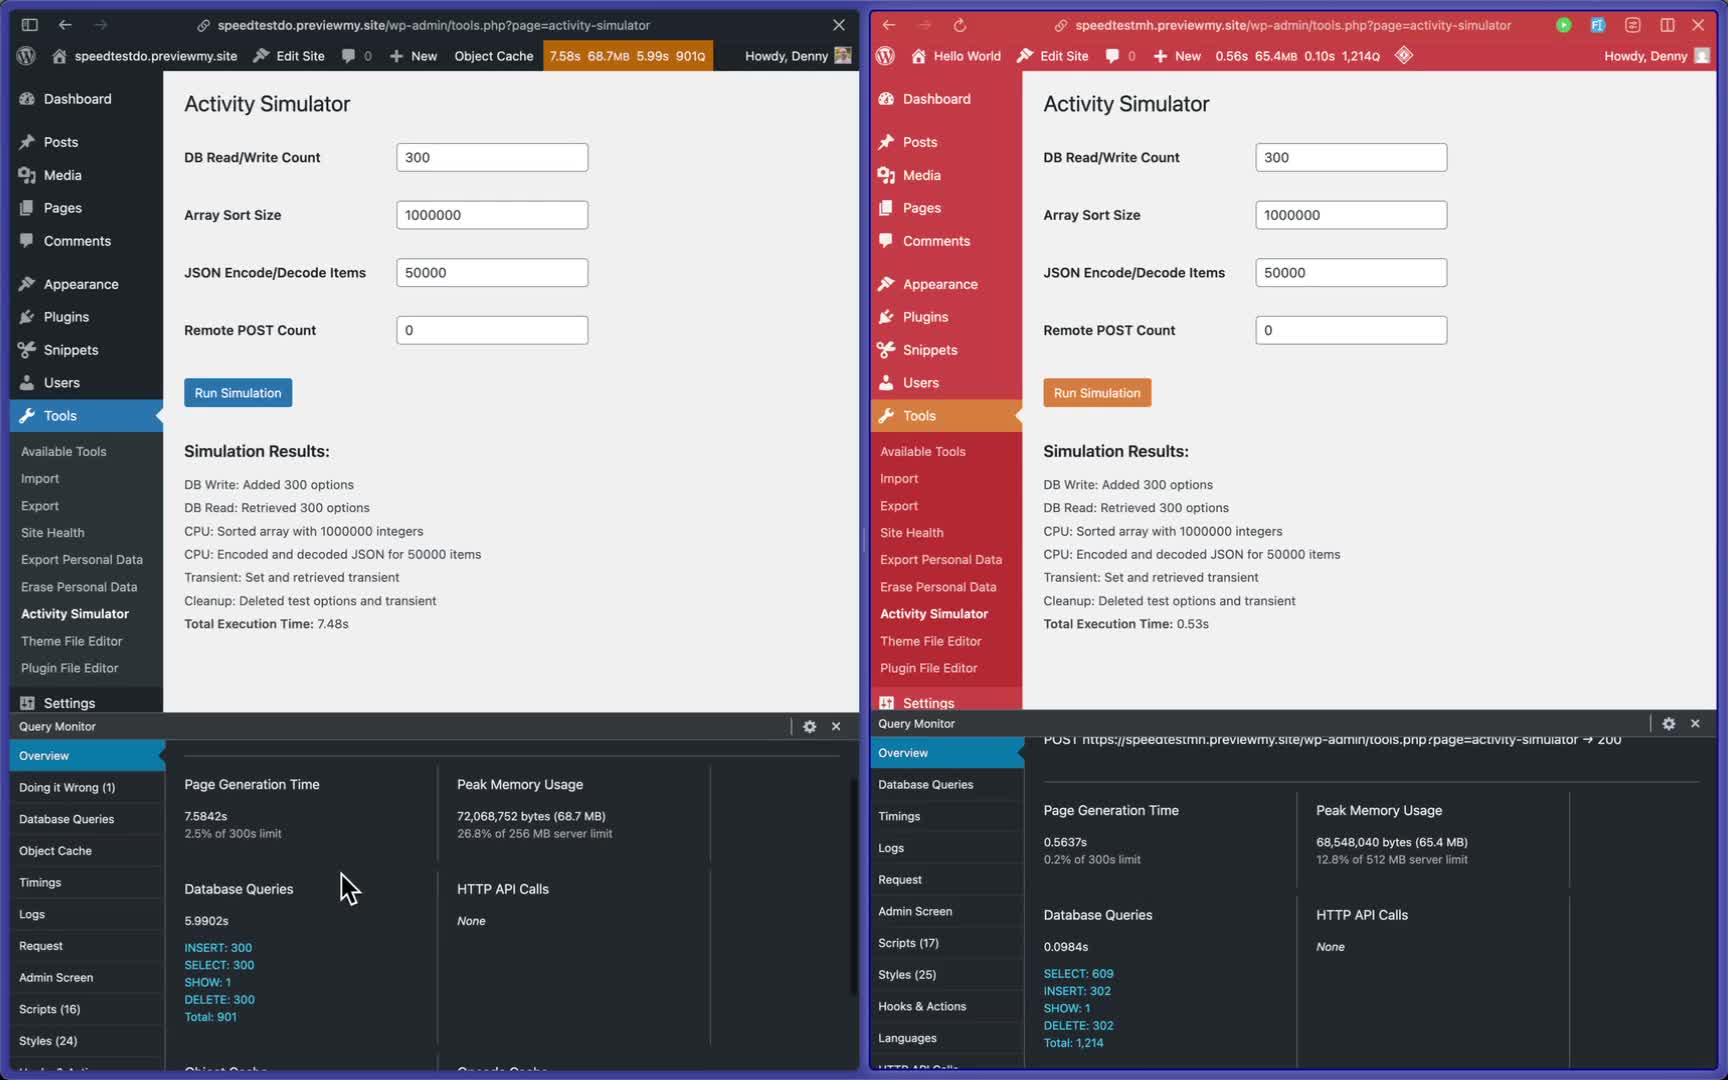
10. Review Overall Performance
- Summarize the total page generation time and other metrics from Query Monitor.
- Compare these metrics to understand the backend performance differences.
11. Final Thoughts and Support
- Reach out for further questions or clarifications regarding specific scenarios.
- Contact Denny at [email protected] or connect with team members for assistance.
Cautionary Notes
- Ensure that both sites are running the same version of WordPress and plugins to avoid discrepancies in performance data.
- Be aware that synthetic tests may not fully represent real user experiences on the site.
Tips for Efficiency
- Regularly monitor backend performance to catch issues early.
- Use caching and CDN services to optimize performance before conducting tests.
- Document findings and adjustments made during testing for future reference.